WASTEWATER MANAGEMENT FOR BEVERAGE PLANT MANAGERS
Prepared by:
Phillip L. Hayden, Ph.D., P.E.
True North Thinking, LLC
561 Congress Park Drive
Dayton, OH 45459
January 2017
TABLE OF CONTENTS
1.0 EXECUTIVE SUMMARY .......................................................................................... 1
2.0 REGULATORY ISSUES........................................................................................... 1
2.1 National Pollutant Discharge Elimination System (NPDES) ..................................... 2
2.2 National Pretreatment Regulations........................................................................... 2
2.3 Storm Water Regulations ......................................................................................... 3
3.0 WATER TREATMENT.............................................................................................. 4
3.1 Lime Softening.......................................................................................................... 4
3.2 Filter and Carbon Backwash Waters ........................................................................ 5
3.3 Membrane Treatment Processes ............................................................................. 5
3.4 Ion-Exchange Resin Reactors .................................................................................. 5
4.0 WASTEWATER........................................................................................................ 6
4.1 Wastewater Characteristics ...................................................................................... 6
4.1.1 Biochemical Oxygen Demand (BOD) ............................................................ 6
4.1.2 Chemical Oxygen Demand (COD)................................................................. 7
4.1.3 Total Suspended Solids ................................................................................. 7
4.1.4 Oil & Grease .................................................................................................. 7
4.1.5 pH .................................................................................................................. 7
4.1.6 Analysis of Beverages ................................................................................... 8
4.2 Measurement of Plant Flow and BOD ...................................................................... 8
4.2.1 Flow Measurement ........................................................................................ 8
4.2.2 Collection of Samples .................................................................................... 9
4.2.3 Plant Efficiency as Compared to Generation of Wastewater ......................... 9
4.2.4 QC Programs ............................................................................................... 11
4.3 Sources of Wastewater .......................................................................................... 12
4.3.1 Syrup Room ................................................................................................. 12
4.3.2 Filling Operations and Change-Overs.......................................................... 12
4.3.3 5-Gal Pre/Post Mix Cleaning and Filling ...................................................... 12
4.3.4 Bag-In-Box (BIB).......................................................................................... 13
4.3.5 Can/Bottle Crushing..................................................................................... 13
4.3.6 Sanitation..................................................................................................... 13
4.3.7 Hi-Fills/Lo-Fills, Off-Spec Beverages (QC Issues) ....................................... 13
5.0 WATER CONSERVATIONS................................................................................... 13
6.0 WASTE MINIMIZATION ......................................................................................... 14
6.1 Collection of High Brixo Streams............................................................................. 14
6.2 Disposal of High Brixo Streams............................................................................... 15
6.2.1 “Hazardous Waste” Considerations ............................................................. 15
6.2.2 Waste Haulers ............................................................................................. 15
6.2.3 Fermentation Plants..................................................................................... 16
6.2.4 Methane Plants............................................................................................ 16
6.2.5 On-Site Anaerobic Treatment ...................................................................... 16
7.0 WASTEWATER...................................................................................................... 16
7.1 Biological Wastewater Treatment Options.............................................................. 16
7.2 Aerobic Wastewater Treatment Options ................................................................. 17
7.2.1 BioFilter........................................................................................................ 17
7.2.2 Activated Sludge/Extended Aeration Processes.......................................... 18
7.3 Anaerobic Treatment Processes ............................................................................ 19
7.4 Aerobic vs. Anaerobic Wastewater Treatment ....................................................... 19
7.5 Membrane Biological Reactors (MBR) ................................................................... 20
7.6 Natural BioFilters .................................................................................................... 21
8.0 WASTE WATERTREATMENT OPTIONS .............................................................. 21
8.1 Data Trending......................................................................................................... 21
8.2 Wastewater Treatment Processes.......................................................................... 22
8.2.1 Desired Effluent Concentration .................................................................... 22
8.2.2 Space Available – Vertical and Horizontal ................................................... 23
8.2.3 Availability and Cost of Utilities .................................................................... 23
8.2.4 Operator Manpower and Automation ........................................................... 23
8.2.5 Regulatory Issues ........................................................................................ 23
9.0 AUTOMATION – CONTROLS ................................................................................ 24
Attachment 1.0 – Lime Softening............................................................................ 25
Attachment 2.0 – Case Histories ............................................................................ 26
Attachment 3.0 – Author’s Background .................................................................. 28
1.0 Executive Summary
Inattention to plant water systems, especially wastewater, can potentially end up costing a beverage plant up to $1,000,000 per year in fines, penalties and excess sewer charges. Cost-saving water and wastewater management programs should be implemented in all beverage plants. A summary of key issues for plant managers are
:
• Regulatory;
• Sewer Fees – BOD, TSS and Flow;
• Water Conservation and Waste Minimization Programs; and
• Payback of Water Management Systems;
Simple cost-effective corrective actions that can be taken by plants are:
• Collecting high BOD waste streams from BIB, 5 -gal, can crushers and syrup rooms;
• Implementing a water conservation program to reduce water consumption; and
• Diverting clean water streams to the storm sewer.
In some cases, implementing these measures could save a plant from $250,000 to $500,000 per year.
The purpose of this white paper is to provide beverage plant managers in the United States with the information required to develop water conservation and wasting minimization programs. Information on environmental laws, managing storm water, wastewater treatment and control systems will be covered. However, international plant managers will find the information useful.
Water Conservation and Waste Minimization Programs are the most cost- effective forms of pollution control. Waste NOT – Want NOT!
2.0 REGULATORY ISSUES
Many beverage plants are experiencing escalating municipal sewer charges due to high flows, suspended solids and BOD concentrations in the wastewater. The reasons for these charges are:
• Municipal wastewater treatment plants (WWTP) are running out of capacity;
• Some municipal WWTPs are not in compliance with their permits;
• Municipalities cannot attract more industry to increase tax base without excess capacity to treat the wastewater; and
• State environmental regulatory agencies are applying pressure.
2.1 National Pollutant Discharge Elimination System (NPDES)
The U.S. Environmental Protection Agency (USEPA) regulates all direct discharges to natural water systems, including creeks, rivers, lakes and the ocean through the NPDES regulations. This also means that all unregulated direct discharges are illegal and subject to fines and penalties.
Prior to discharge, the entity must apply for and receive a NPDES permit, which will regulate the parts per million (ppm) and/or pounds per day (lbs/day) of regulated pollutants. The NPDES limits are established by regulations or according to the volume of the receiving stream. Many times, the stream must be modeled to determine to the assimilative capacity. For example, the assimilative capacity of the stream for BOD depends on the dissolved oxygen levels, which is a function of velocity, depth and turbulence.
The NPDES permit specifies the number and frequency of parameters to be monitored and self- reported. This means the plant must have an approved flow monitoring and sampling station installed. Normally a state certified laboratory is required to collect and analyze the samples, and report the results.
Unregulated direct discharges and plants not in compliance with their NPDES permits are subject to fines and penalties. The FEDS are less tolerant and have more muscle than municipalities. Beverage plants should avoid NPDES permits if all possible, because of the liabilities associated with this option.
2.2 National Pretreatment Regulations
The U.S. Environmental Protection Agency requires all municipalities to develop sewer ordinances to regulate the discharge of industrial wastes to the sewer system. These ordinances regulate a wide range of contaminants, including:
• Materials that would cause harm to the sewer system or to the workers, including flammables, explosives, acids and caustics, and toxic gases such as hydrogen sulfide, cyanides or ammonia;
• Grease or materials that would clog up the sewer;
• Toxic materials that would interfere with biological treatment;
• Regulated pollutants that would impact the effluent and compliance with the NPDES Permit;
• Toxic materials that would impact disposal of the sludge; and
• Materials that would consume energy or chemicals during treatment, including organics that exert biochemical oxygen demand (BOD) and total suspended solids (TSS).
All users in a municipal sewer system must apply for and obtain a permit prior to discharging wastewaters. This permit is similar to a NPDES permit in that the plant must record flow and collect samples of wastewater. A certified laboratory will normally collect and analyze the samples, and report the results.
Each city is organized differently but a wastewater department within Public Works normally manages the industrial wastewater program. This Industrial Wastewater Department (IWD) is responsible for monitoring industrial discharges and normally will periodically measure flows and collect samples of the wastewater to determine whether the plant is in compliance with its permit. The same data can then be used to establish sewer charges.
Important factors to remember:
• The IWD must be notified whenever there is a change in the bottling or treatment process, or nature of the wastewater;
• It is the responsibility of the Plant to provide access (if required) to the IWD field crew to collect the wastewater samples;
• It is the responsibility of the plant to ensure self- reported data is accurate;
• The IWD must be immediately notified in the event of a spill or unusual slug of concentrated wastewater;
• Sometimes IWD makes a mistake or takes a non- representative sample that results in a very high monthly sewer bill. A knowledgeable person should review the bills. Errors should be contested.
It is very important that plant mangers or their representatives monitor the activities of the local IWD, especially with respect to new regulations or adjustment of sewer charges. Since proposed changes to regulations or charges are normally presented in public meetings, plant representatives must attend and make their views known.
2.3 Storm Water Regulations
Storm waters discharged from municipalities and industrial plants are regulated by the USEPA. Under the Phase 1 program, there are eleven categories of facilities that require NPDES permits for storm water discharges. Beverage plants are not included in this program unless there is a potential for storm water discharge of materials, such as sugar, high fructose corn syrup, chlorine, acid, caustic, beverages from can crushing, oils, paints, etc.
If beverage plants can answer NO to a number of questions relating to the manner in which raw materials, finished products and chemicals are handled and stored, they can obtain a “Conditional No Exposure Exclusion for Industrial Activity”. NO means that there is no way possible for these materials to end up in the runoff or storm waters.
There is a form that can be downloaded from the USEPA WebPages and submitted either to the state environmental agency or to the local municipality.
All municipalities are regulated under the Storm Water Regulations and designated as MS4 (municipal separate storm sewer system) and consist of the entire storm conveyance system, including storm sewers, ditches, and retention ponds, etc. Large and medium MS4s were regulated under Phase 1 regulations in 1987, with small MS4s being regulated under Phase 2 regulations in 2003. What this means to beverage plants is that the local municipality probably administers the storm water process.
Why is this important to beverage plants?
First, plants should file a “Conditional No Exposure Exclusion for Industrial Activity” with the local municipality. Verify this in advance since there are some areas where storm water regulations are being enforced by the state and possibly the EPA.
Second, plants should investigate discharging some of the clean water streams to the storm sewer. These include, settled filter backwash water, non-contact cooling water and possibly, reject water from membrane treatment, e.g. reverse osmosis. Significant sewer charges can be avoided by reducing flow to the sewer.
3.0 WATER TREATMENT
Regardless of the source of water, bottling plants employ a wide range of water treatment processes to obtain quality standards. Each of these processes generates a waste stream that must be managed.
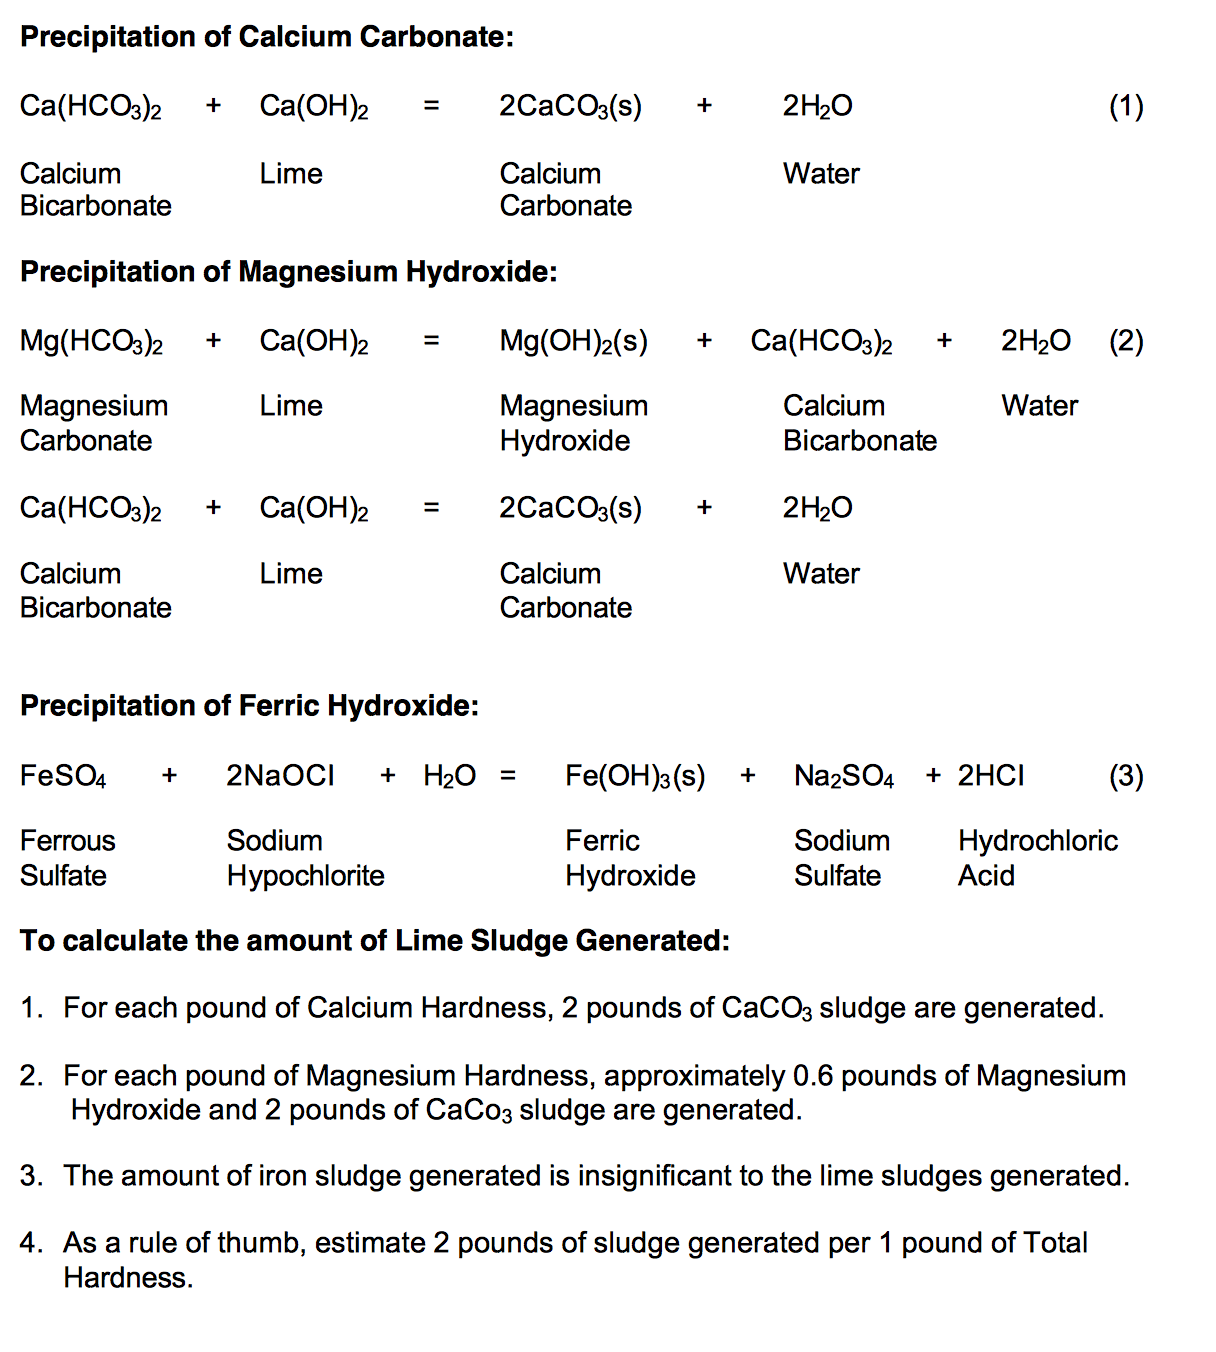
3.1 Lime Softening
Lime softening processes utilize the addition of calcium hydroxide (lime), sodium carbonate (soda ash) and ferrous sulfate (iron sulfate). The addition of these chemicals results in the precipitation of the hardness ions, calcium and magnesium, and the alkalinity ions, bicarbonate and carbonate. The lime softening processes generate a large volume of solids, consisting of calcium carbonate, magnesium hydroxide and ferric hydroxide. For each pound of hardness treated, this process generates approximately two pounds of dry solids.
400,000 gpd of 400 ppm hardness will generate approximately 2,668 lbs of dry solids. Assuming a 5% solids sludge is generated, the volume would be 6,400 gallons of liquid sludge.
Assuming the plant discharges the lime softening sludge down the sewer and total wastewater flow is 100,000 gallons per day, the total suspended solids (TSS) concentration would be 3,200 mg/L.
Many municipalities levy surcharges on manufacturing plants that discharge TSS concentrations in excess of the levels in sanitary sewage, when generally range from 250 mg/L – 350 mg/L. These surcharges may range from $0.05 to $0.30/pound, or for the example listed above, annual sewer charges for TSS may range from $15,000 to $100,000 per year. At $100,000 per year, there are very cost-effective disposal options with quick paybacks that will be discussed later on in this paper.
3.2 Filter and Carbon Backwash Waters
Sand, mixed media and carbon filters must be backwashed at regular intervals to remove collected solids. Assuming three, 8-foot diameter filters are backwashed at 15 gpm/ft2 for 10 minutes, total flow would be 15,000 gallons per day.
Collecting the backwash water and recycling back to the head of the water treatment plant or discharging to the storm sewer are possible options, especially if the water source is municipal or ground water.
If the water source is surface, such as a lake or river, it may not be prudent or possible to recycle the backwash water due to the present of giardia or cryptosporidium.
3.3 Membrane Treatment Processes
Membrane processes, such as reverse osmosis, generate reject streams consisting of 10% to 30% of the original raw water flow. The reject stream contains concentrated salts and solids plus chemicals used to prevent precipitation of scaling chemicals, such as acids and chelants. Assuming a permeate or product flow of 400,000 gpd, the reject flow could vary from 44,000 gpd to 171,000 gpd.
Depending on the TDS (total dissolved solids), the pH, COD (chemical oxygen demand) and oil concentrations, it may be possible to discharge the reject stream to the storm sewer (Section 1.3).
3.4 Ion-Exchange Resin Reactors
Softeners, specific ion resin beds and de-alkalizers all employ ion-exchange resins to exchange one ion for another. As the water passes through the bed, ions in solution such as the hardness ions, calcium and magnesium, for sodium and specific ions such as nitrate and fluoride ions are exchanged for chloride ions.
Regeneration produces a waste stream consisting of high levels of acids, caustic or salts.
4.0 WASTEWATER
4.1 Wastewater Characteristics
4.1.1 Biochemical Oxygen Demand (BOD)
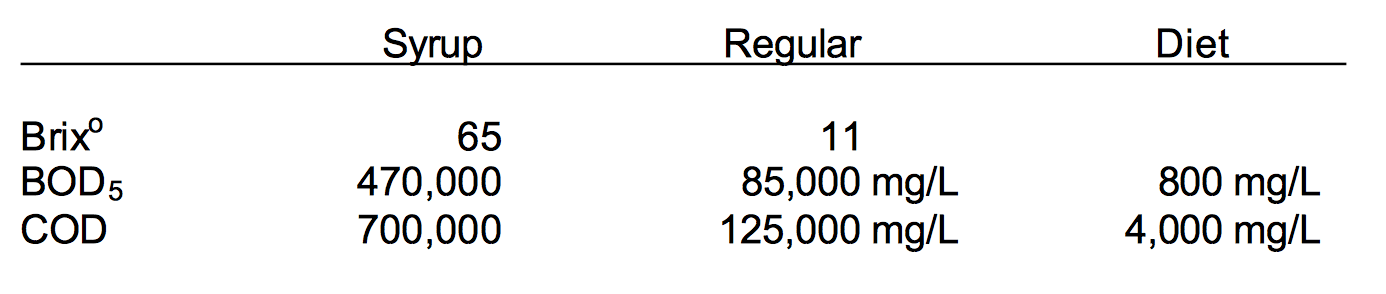
Wastewaters discharged from beverage plants are easy to characterize since there are no toxic organics, heavy metals or any regulated pollutants. The primary contaminant is sugar, which comes from diluted syrup and product beverages.
Sugar exerts an oxygen demand, whether in a WWTP or in a stream or river. An oxygen demand in a municipal WWTP means that mechanical aeration must be applied to maintain a certain level of dissolved oxygen so the treatment process will continue to function. An excessive oxygen demand in a stream will cause fish to die.
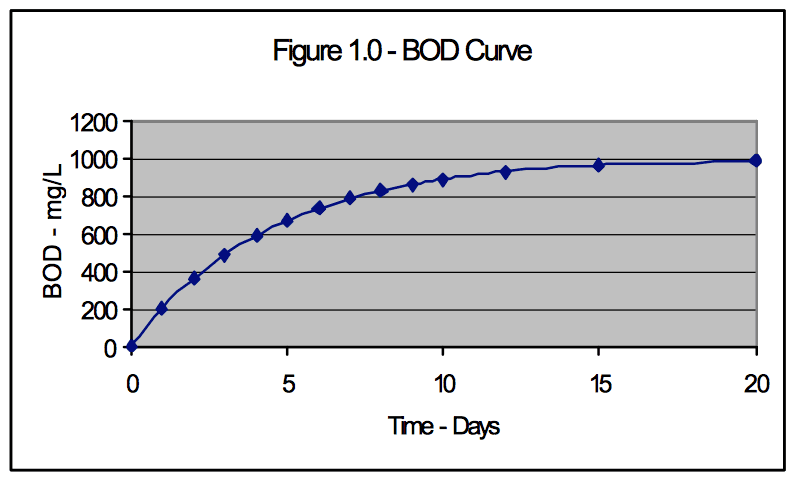
The primary analytical method used to measure oxygen demand is the 5-day Biochemical Oxygen Demand (BOD5) test. This test is carried out by placing samples of the wastewater in 300-ml BOD bottles and adding water saturated with oxygen.
The initial oxygen concentration is measured with a dissolved oxygen (DO) meter and then placed in an incubator controlled to 20oC. Five days later, the bottles are removed and the DO measured. The depletion of DO times the dilution factor indicates the BOD5 of that sample. Figure 1.0 shows the BOD curve versus Time in Days, assuming an ultimate or theoretical BOD of 1,000 mg/L. The curve also indicates BOD5 is approximately 2/3 or 67% of the theoretical value.
All organic compounds have a unique oxygen demand, depending on the number of carbon, hydrogen and oxygen atoms in the molecule. For example, the BOD of a sugar (sucrose) can be calculated according to the following equation:

Assuming that 1-gram of sucrose is added to 1 liter of water, the theoretical BOD can be calculated:
1,000 ppm * 384/342 = 1,123 mg/L
Assuming the 5-day BOD is equal to 2/3 or 0.67 of the theoretical BOD, the BOD5 would equal:
1,123 ppm * 0.67 = 751 mg/L
4.1.2 Chemical Oxygen Demand (COD)
Another common method to measure oxygen demand is
the COD. The COD test consists of placing a sample of
wastewater in a flask with concentrated sulfuric acid and
potassium dichromate, the combination of which produces
chromic acid, a very strong oxidant. The flask is heated
for 2 hours and the residual dichromate analyzed. The
amount of dichromate consumed is directly proportional to
the oxygen demand. The primary advantage of the COD
is that the test can be completed in 2 hours whereas the BOD test requires 5 days. The COD is approximately the same value as the ultimate 20-day BOD.
Assuming the same example in equation 2, the COD of a 1,000 mg/L solution of sucrose would be 1,123 mg/L.
4.1.3 Total Suspended Solids
The only other parameter of interest in beverage wastewater is the measure of suspended solids, resulting from the blowdown sludge from lime softening. This is a simple test in that a sample of wastewater is filtered through a Millipore filter, dried and weighed.
4.1.4 Oil & Grease
Beverage plants normally do not discharge Oil & Grease (O&G) concentrations in excess of 20 mg/L. However it should be emphasized that the O&G analytical test will indicate solvent extractable organics, such as surfactants that are present in conveyor lubricants and sanitizers.
As a result, O&G concentrations may be actually lower than analytical tests would indicate. A lab must use special procedures to differentiate the difference of O&G and surfactants.
4.1.5
pH
All permits will require the wastewater pH to be in the neutral range of 6 to 9. Some municipal permits will allow a wider pH range, but that is unusual.
Standard Methods for Examination of Water and Wastewater contains all the required water and wastewater analytical methods. Each plant should have the latest edition in the QC Laboratory for reference purposes.
4.1.6 Analyses of Beverages
4.2 Measurement of Plant Flow and BOD
To accurately measure wastewater discharge from a beverage plant, it is necessary to have a sampling station where the flow can be accurately measured and flow- proportioned samples can be obtained. Most municipalities require the sampling station to be located on the process sewer where no sanitary wastewaters are included.
4.2.1 Flow Measurement
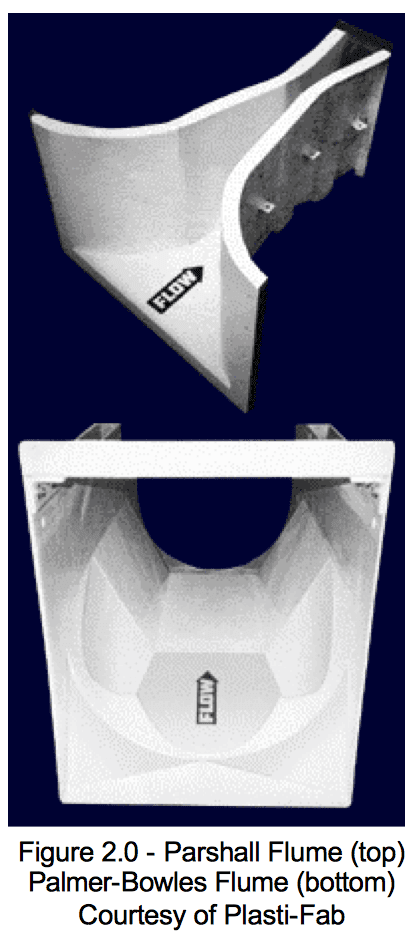
Sewer flows are normally measured in a free flowing sewer with a flume inserted into a manhole, where the height of the water flow indicates the flow. There are two principal flumes that can be used.
A Parshall Flume (Figure 2.0) is in the shape of a venturi and is normally located in an
open channel or constructed as part of a flow-monitoring manhole. To measure flow,the height of the water at the entrance to the flume is measured.
A Palmer-Bowles flume is similar to the Parshall Flume but it is round and inserted into the incoming sewer pipe leading into a manhole. This flume is useful in that it can be used in an existing manhole. No special construction is required. These flumes can be purchased through Plasti -Fab, www.plasti - fab.com.
To measure flow through a flume, a flow recording instrument is required that measures the height of the water. There are many sensors used to indicate height of water flow, including an ultra-sound device, a float, bubbler, a flow or a pressure transducer. ISCO (www.isco.com) has a wide range of flow recording instruments for the measurement of open channel flow.
If the wastewater effluent is pumped through a closed pipe into the sewer, a mass or ultrasound flowmeter is normally used to
measure the flow. Endress-Hauser (www.endress.com) is a source of magnetic flowmeters.
4.2.2
Collection of Samples
There are three types of wastewater samples:
• A Grab Sample is collected in a single container at one time. This is a snapshot of the wastewater at the time of sampling.
• A Time-Proportioned Sample is a series of samples of equal volume collected at equal time intervals and combined into a single sample. For example, a 24-hour time-proportioned sample may consist of 24 samples collected at one-hour intervals combined into a single sample. A time-proportioned
sample can be collected with an automatic sampler programmed to collect a sample at a given time interval.
• A Flow-Proportioned Sample is a series of samples of equal volume collected according to the flow. To collect a flow-proportioned sample, an automatic sampler would be connected to a flow recording instrument and programmed to collect a sample at the end of a given amount of flow. For example, for a 24- hour, flow-proportioned sample, the sampler would collect a sample for each 1,000 gallons of measured flow over a 24-hour period.
To accurately characterize a wastewater discharge to a sewer for compliance purposes, It is mandatory to collect flow-proportioned samples.
Many permits are written in terms of concentration (mg/L or ppm) of BOD5 and TSS with no reference to flow. Although the primary impact of BOD is the mass loading on a WWTP or a stream, municipalities only consider concentration since it is more difficult to accurately monitor than pounds. The reason is that to monitor pounds, it is necessary to obtain both flow and flow-proportioned samples, a more difficult procedure than obtaining grab or time-proportioned samples.
When municipalities write these permits in terms of BOD concentrations, they provide no incentives to reduce flow. In fact, the incentive is to increase flow to reduce concentrations, which reduces sewer charges.
4.2.3 Plant Efficiency as Compared to Generation of Wastewater
There are many factors that affect the volume and strength (BOD concentrations) of wastewaters discharged from beverage plants. It is a known fact that well run plants generate less waste than poorly run plants. Management attitude and control are the primary factors. The amount of wastes is dependent on how much of the syrup is converted into a quality product.
Our measure of plant efficiency used to calculate plant efficiency is to calculate the daily
production of BOD 5 in terms of pounds or
kilograms.
We know the
BOD 5 concentrations of products (Section 3.1.4) and if we know the volume of production and the packages, we can calculate the total amount BOD5 produced by the plant.
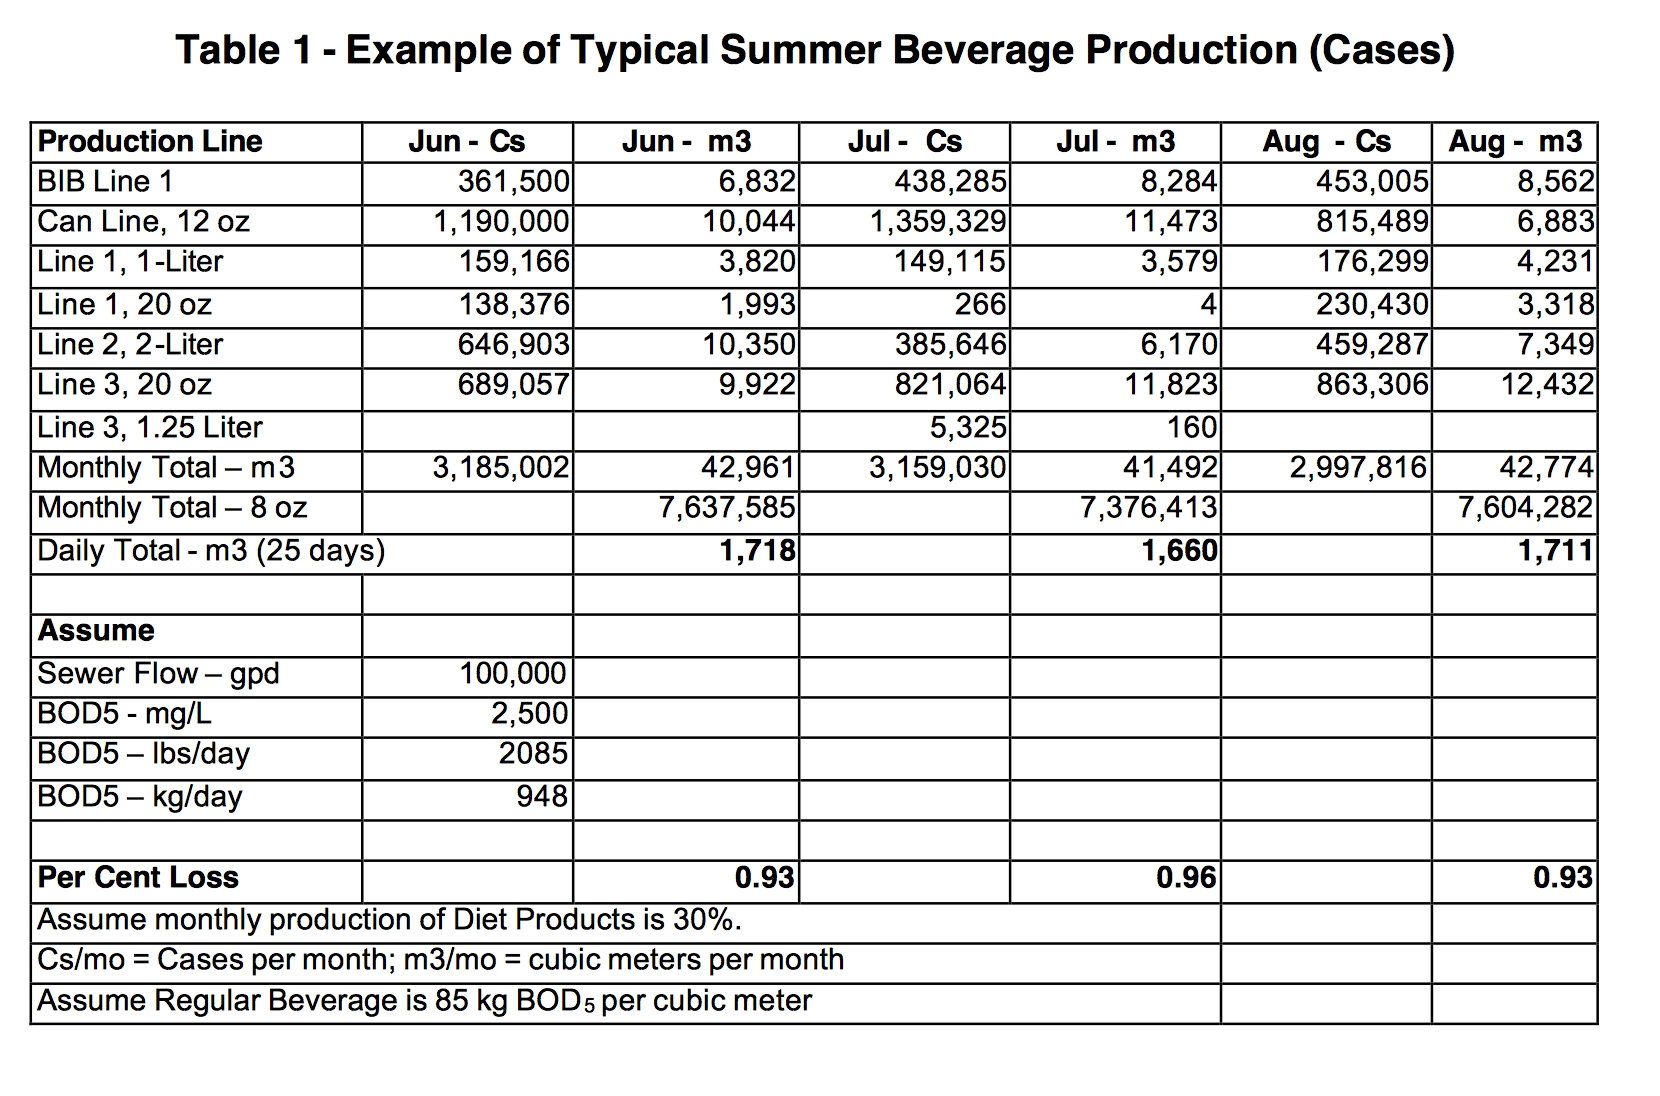
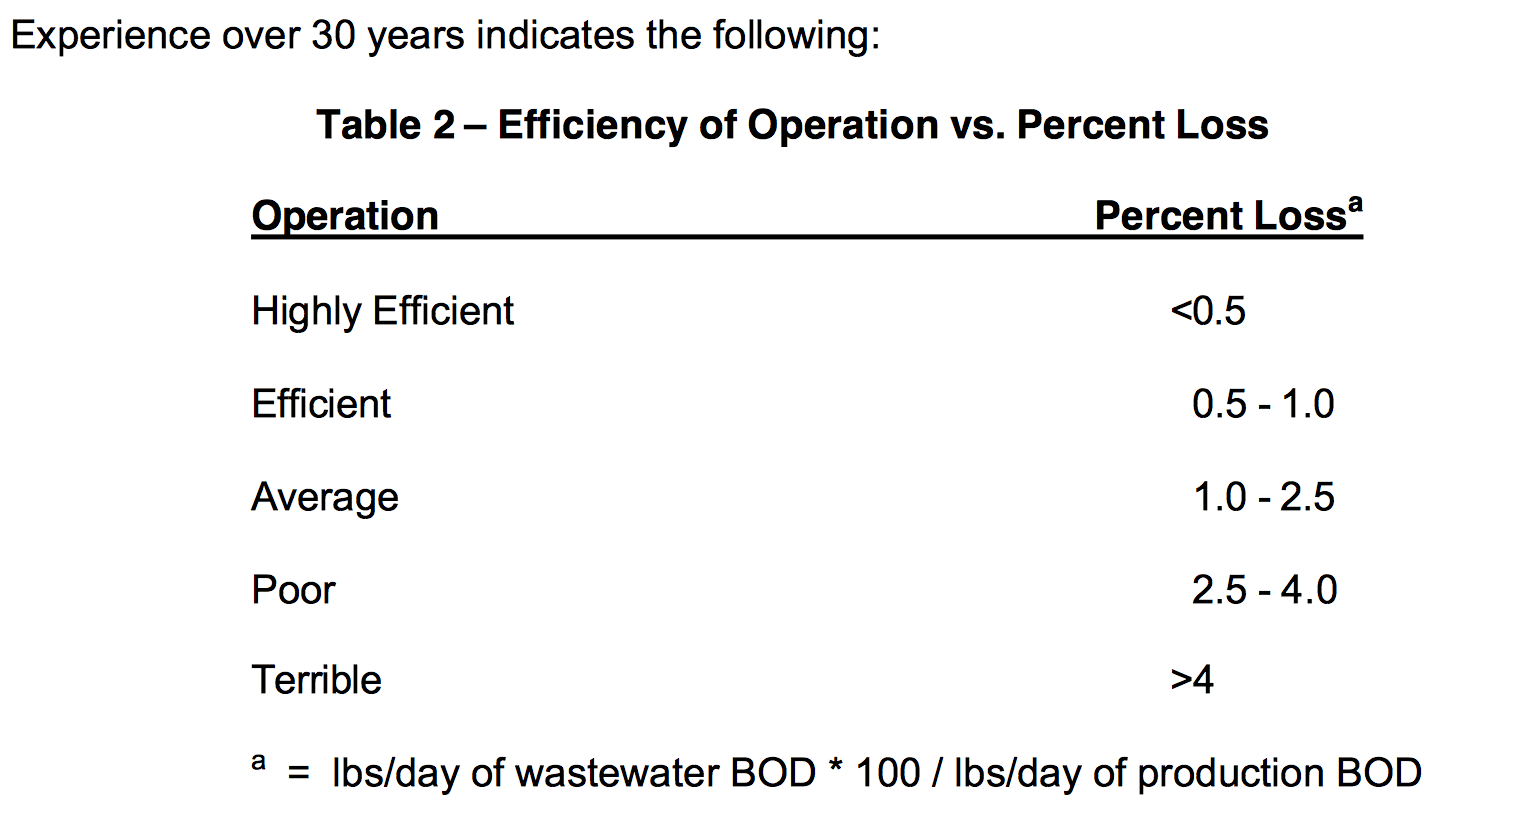
A typical exercise is to enter daily production values on a spreadsheet along with daily wastewater flows and BOD5 concentrations. Using this data, we can estimate the percent (%) loss on a daily basis. However, many times going into a beverage plant to perform an audit, we have only monthly production. Table 2.0 shows an example of monthly production and estimated sewer flow and BOD5 concentrations in metric terms.
• Sum up the monthly production and assume 25 days per month;
• Calculate daily production in terms of cubic meters;
• Assume regular beverage is 85 kilograms of BOD5 per cubic meter (kg/m3);
• Calculate daily production in terms of kg/day;
• Analyze available wastewater data to determine average flow and BOD5 concentrations;
• Calculate kg/day of BOD5 discharged;
• Divide kg/day BOD5 by kg o f product per day; and
• % Loss represents the BOD5 down the sewer as compared to BOD5 processed through the plant.
Percent Loss indicates the overall efficiency of the beverage plant with respect to generation of pounds or kilograms of BOD. It is important to understand that concentration is not the same as mass. You can have a low flow and high BOD, and a high flow and low BOD that results in the same mass discharge of BOD.
Pounds per Day of BOD = (mg/L BOD * 8.34 lbs/gal * gallons/day) / 1,000,000
Kilograms per Day of BOD = (mg/L BOD *cubic meters/day) / 1,000,000
4.2.4 QC Programs
It is the plant’s responsibility to select competent outside laboratories that will produce accurate data. The plant should implement an internal QC program that will monitor the accuracy of the data. Procedures to be adopted are:
a. Occasionally split the wastewater sample and submit both samples for analysis;
b. Dilute a soft drink 1:100 and submit diluted sample for analysis; and
c. Have the samples analyzed for both BOD5 and COD.
4.3 Sources of Wastewater
The primary sources of wastewater are:
• Syrup Room;
• Filling Operation and Change-Overs;
• Water Treatment;
• 5-Gal Pre/Post-Mix Cleaning and Filling;
• Bag-In-Box (BIB);
• Can Crushing;
• Sanitation; and
• Hi-Fills/Lo-Fills, Off-Spec Beverages.
4.3.1 Syrup Room
The Syrup Room represents a potential of 50% of all BOD discharged to the sewer. This is due to the concentration of the sugar in the syrup, which may be as high as 60% of the liquid volume.
BOD is discharged from the Syrup Room from leaks, drips and during CIP operations. It has been documented that 60% of the total BOD is washed from a syrup tank during the first 11⁄2 minutes of the first rinse.
4.3.2 Filling Operations and Change-Overs
Leaks and drips are the major sources of BOD during filling operations. This is generally due to old equipment or poor maintenance. Leaking seals, joints, gaskets, etc. all contribute. Foaming, due to warm product, is also a potential problem.
Frequent Change-Overs will greatly increase BOD
discharged to the sewers. Although procedures designed to
optimize production, such as blowing out the lines and
metering the syrup down to the last drop, there is still
significant amount of BOD in the sanitation water due to the concentrated nature of the syrup. With limited warehouse space and as they say, if the plant is producing “Dog & Cats” specialty items, it is difficult to control this source of BOD.
4.3.3 5-Gal Pre/Post-Mix Cleaning and Filling
When the 5-Gal Cans come back from the trade and are 1⁄2 full of post-mix syrup, this small operation can be the major source of BOD in a beverage plant. The only solution is to segregate and collect the excess product. Many plants will drain the cans prior to cleaning into a sump and pump the liquid into a storage tank outside the plant. This concentrated BOD stream is then hauled away and disposed of separately. Disposal of high strength BOD streams will be discussed in a later section.
4.3.4 Bag-In-Box (BIB)
Post Mix BIBs that break, leak or come back from the trade are the same problem as the 5-Bal Cans. They represent a major source of BOD. Some plants also collect the BIB waste streams and pump to the same storage tank.
4.3.5 Can/Bottle Crushing
Can/Bottle Crushing can also represent a major source of BOD in the plant. Leaking cans, high/low-fills, out-of-spec product and returned product from the trade are normally disposed of by crushing the container and discharging the residue down the sewer. Some plants collect the waste stream by pumping to the same storage tank.
4.3.6 Sanitation
A 5-step Sanitation is not a large source of BOD since most of the sanitizing chemicals (sanitizers, surfactants, etc.) are used in low concentrations.
4.3.7 Hi-Fills/Lo-Fills,
Off-Spec Beverages (QC Issues)
Off-Spec Beverages, whether caused by Hi/Low-Fills, brixo, CO2, or other reasons, can be generally related to a QC issue which can have many causes. It is beyond the scope of this paper to discuss QC issues in a beverage plant but it suffice to say that poor QC generates more wastewater.
5.0 WATER CONSERVATION
Developing a Water Conservation program is relatively easy – Find out where the water goes and see if the flow or quantity can be reduced.
The obvious steps are:
• Install pressure operated nozzles on all water hoses – Prevent water hoses from running without operator involvement;
• Tighten up leaks and drips;
• Minimize backwash (time and flow) of mixed-media and carbon filters to that
absolutely required to maintain sanitation and process efficiency;
• Reclaim backwash waters, if possible;
Optimize membrane efficiency to minimize reject water – have to work with water suppliers for this option;
• Recycle cooling water – eliminate single-pass systems; and
• Eliminate on-site truck washing, if cost justified;
The next step is to wire up the water system with flow meters and a data acquisition system to monitor water flow through the system. The whole issue of automation and controls will be discussed in depth in a later chapter.
6.0 WASTE MINIMIZATION
As mentioned at the front of this paper, “Waste Not – Want Not”. A Waste Minimization program is designed to identify and reduce the amount of waste product and syrup going to the sewer, which is indicated by the BOD in the wastewater.
The primary sources of BOD are listed in Section 3.3. Now that the sources are identified, what do we do about it?
6.1 Collection of High Brixo Streams
For the 5-Gal, BIB and can crushing processes and for disposal of off-spec products, collection is straightforward; install a sump or tank where the liquid is poured or collected and pumped to an outside storage tank.
For the filling and syrup rooms, the process is a little more complicated. For the syrup rooms, the tank discharge line normally discharges the first rinse to the floor and the liquid runs into the sewer. To collect the first rinse, a process Brixo Meter (http://www.refractometer.com/) and a three-way automatic valve should be installed on the line leading from the tank. When the measured brixo is above a given number, say 5o, the waste is diverted to the storage tank outside. When measured brixo is less than this value, the waste is directed to the sewer.
To collect high BOD streams from the filling rooms, a sump with a float-actuated pump must be installed. On the discharge side of the pump is a Brixo Meter and three-way automatic valve. During normal filling operation, when the leaks and drips consist of high brixo liquids, the flow is discharged to the storage tank. When low brixo liquids are indicated, the flow goes to the sewer.
6.2 Disposal of High Brixo Streams
6.2.1 “Hazardous Waste”
Considerations
“Hazardous Waste” is a legal term used to designate a regulated, waste material that is deemed to be hazardous by the U.S. Environmental Protection Agency. There are listed “Hazardous Wastes”, which means the name of the wastewater material is actually listed in the regulation (40 CFR 261.33). An example is F001 – Spent halogenated solvents used in degreasing. There are over 500 listed “Hazardous Wastes”. A material may be designated as “Hazardous Waste” by characteristic. Examples are ignitable (will burn), corrosive (acid/caustic), reactive (explode) and toxic (toxic chemicals) wastes.
High Brixo Streams present a potential “Hazardous Waste” problem due to corrosivity, which is defined by materials with a pH =< 2.0 and =>12.5.
Since “Hazardous Wastes” are regulated by the U.S. EPA, there are severe monetary and criminal penalties associated with the improper disposal. To transport “Hazardous Wastes” from the property requires a licensed transporter, which must take the waste to a licensed treatment, storage and destruction (TSD) facility.
The pH of any waste stream that is
discharged from a beverage plant should be measured to determine whether the waste is a characteristic “Hazardous Waste”. If the pH of the waste stream is less than 2.0, the waste should be blended in with the balance of the wastewater and neutralized prior to discharge to a municipal sewer.
As a side note, when the Hazardous Waste laws were being written, the original lower pH limit was 2.5. When someone noted that soft drinks could be classified as “Hazardous Wastes”, the lower pH limit was changed to 2.0.
6.2.2 Waste Haulers
Strange as it may seem, it may be less expensive to have a waste hauler or “honey dipper” pick up the waste liquid and transport to a nearby wastewater treatment plant rather than discharge down the sewer. Many times, the plant discharges into a small WWTP with high sewer charges. The waste hauler can transport to a nearby large WWTP and pay less fees.
However, this option is only possible, if the waste has a pH greater than 2.0.
There is one caution. The plant is ultimately responsible for the safe disposal of any regulated or unregulated wastes that originate on their property. For example, if a waste hauler picks up a load of high BOD wastes and dumps the load into a stream or river, the plant is responsible for the damages.
If liquid wastes are transported from the facility, it is mandatory to receive a document or manifest from the hauler indicating the ultimate disposal site.
6.2.3 Fermentation Plants
There are fermentation plants, e.g. yeast plants, in some parts of the country use molasses and high sugar wastes as a substrate. There are plants which will pick up Hi-BOD wastes, with a minimum of 5 brixo. However there are only two plants in the country.
6.2.4 Methane Plants
There are some companies in the business of generating methane gas from the anaerobic treatment of Hi-BOD wastes.
6.2.5 On-Site Anaerobic Treatment
If none of these options are available, one option may be to treat the Hi-BOD waste stream in an on-site anaerobic treatment plant. Anaerobic treatment is well suited to high concentrations of BOD, requires a small footprint and can be automated. Anaerobic wastewater treatment is discussed more in depth in Section 7.3.
7.0 WASTEWATER TREATMENT
7.1 Biological Wastewater Treatment Options
Biological processes are the only practical wastewater treatment alternatives for beverage wastewater. This is due to the high levels of sugar in the wastewater. No other treatment process (coagulation, chemical oxidation - ozone or chlorine, or activated carbon) is feasible.
All biological processes utilize high concentrations of bacteria to metabolize the sugar, which means that each process must have high concentrations of bacteria to obtain reasonable kinetic rates. All biological processes generate waste sludges, which may vary in volume significantly. As a result, much of the wastewater treatment plant is devoted to sludge handling.
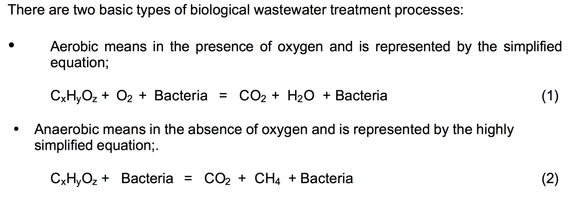
Both of these equations indicate that bacteria are required for reducing organics to simpler, non-polluting constituents.
7.2 Aerobic Wastewater Treatment Options
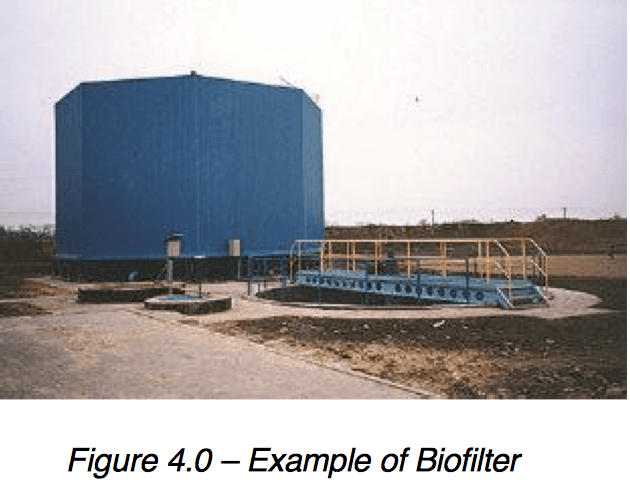
There are two basic aerobic treatment processes – attached growth and suspended growth, i.e. bacteria growth. Attached growth means that liquid is circulated over a bacterial slime layer, attached to a surface. The BOD diffuses into the slime layer and is metabolized to CO2 and H20, which is washed out of this layer. The slime layer is maintained in an aerobic condition by air or oxygen dissolved in the water circulating over the layer. An example of such an attached growth process is a Biofilter.
Suspended growth means that bacteria are suspended in the liquid and oxygen is supplied by bubbling air into the liquid. The bacteria growth, normally called biosludge, is separated from the clarified liquid. Aerobic processes require nutrients, nitrogen and phosphorus, to be in the proper concentration to support the growth of bacteria and that pH is in the neutral range (6.5-9.0).
7.2.1 BioFilter
A Biofilter, or more commonly known as a “Tickling Filter,” is similar to a cooling tower where water is circulated over plastic media with a high surface area (100m2/m3). For a BioFilter, a bacterial or slime growth attaches to the plastic media surface.
As wastewater is circulated over the media, BOD diffuses
into the slime layer where the attached bacteria metabolizes
the soluble organics or BOD and the waste products washed
out of the layer. The process is maintained in an aerobic
condition from vents in the bottom of the tower that allows a
draft of air through the tower due to temperature differential
from the air and liquid. The BioFilter is an excellent, cost
effective process for removing 60-80 percent of the BOD
and is space efficient in that towers of up to 30 feet can be constructed. However, removals above 80 percent required
larger and larger processes with diminishing incremental BOD removals.
The advantages of such a BioFilter are:
•
Quick start-up;
•
Dampens out fluctuating flows and BOD loadings;
•
Responds quickly to toxic shocks; and
•Generates less biological sludge, as compared to other aerobic
processes.

A Submerged BioFilter is another attached growth process that
is very effective. Plastic media is installed in a tank that will be
submerged in the wastewater. Air is supplied from air diffusers in the bottom of the tank. An advantage of this process is that the tank can be used for treatment and equalization. With 15-18 hours retention, BOD removals of 50 percent can be obtained in an open tank. With the installation of plastic media with high surface area, oxygen transfer efficiencies are increased and BOD removals are significantly increased.
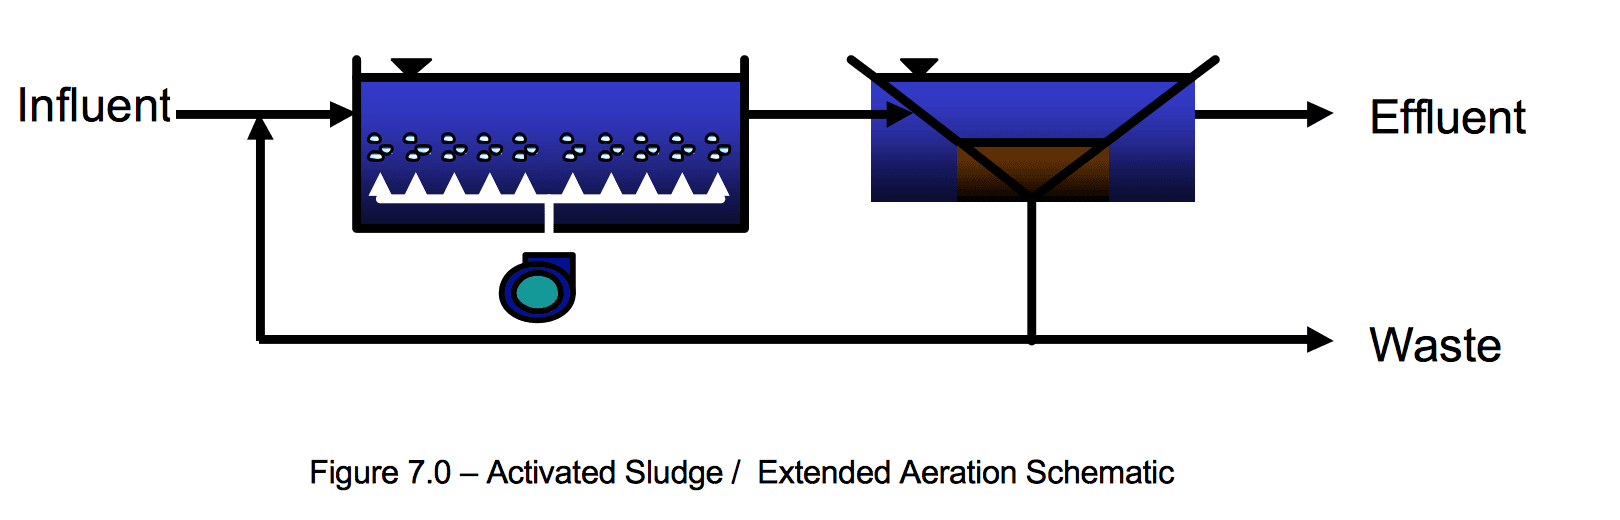
7.2.2 Activated Sludge/Extended Aeration Processes
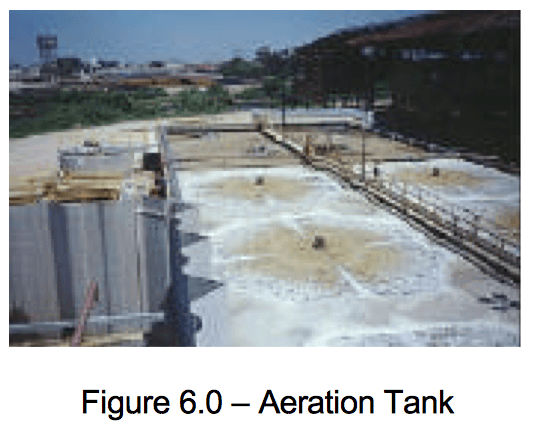
Activated Sludge and Extended Aeration are suspended growth processes that utilize open aeration tanks to contain the biosludge and the wastewater. The differences between these two processes are the organic loadings and hydraulic retention time. Oxygen is supplied from dispersed air from diffusers located in the bottom of the tank.
A clarifier or sedimentation tank follows both processes to separate the suspended bacterial growth or biosludge, with the clarified liquid discharged to the sewer or river. The sludge is concentrated at the bottom of the clarifier and recycled back to the aeration tank. A typical arrangement is shown in Figure 6.0.
Activated Sludge/Extended Aeration treatment processes are extremely efficient at producing high quality effluents, with BOD5 and TSS concentrations less than 10 mg/L. However these processes are more sensitive than BioFilters to toxic shocks and high loads.
The key difference between these two processes is the organic
loading, which is kg (or lbs) of BOD5/kg of MLVSS-day. MLVSS is Mixed Liquor Volatile Suspended Solids and indicates the concentration of bacteria in the biosludge. This loading factor is often referred to as the F/M (food to microorganism) ratio. Activated Sludge processes have F/M ratios greater than 0.1, whereas Extended Aeration is less than -.1. To treat similar waste loads, and Extended Aeration plant would be considerable larger in size.
The reason that organic loading is so important with these processes is that especially with carbohydrate wastes such as sugar, filamentous bacterial predominate in the biosludge at F/M ratio greater than 0.1. Filamentous bacteria are very deleterious to the process in that the biosludge will not settle in the clarifier (Figure 7.0) and therefore cannot be separated from the liquid. If the biosludge will not settle, the sludge cannot be returned to the aeration tank and treatment will not occur.
7.3 Anaerobic Treatment Processes
Anerobic treatment processes are used widely in beverage and fruit processing plants, especially breweries, because of the efficiency and simplicity of the process. Anaerobic processes work very well with simple carbohydrates such as alcohol and sugar. Anearobic processes are carried out in closed tanks where the wastewater passes upward through an anaerobic sludge blanket. The BOD is converted to a gas, consisting of 70 percent methane and 30 percent dioxide. A typical process is UASB (upflow anaerobic sludge blanket).
Anaerobic processes generate methane gas that, if in sufficient quantities, can be used in boilers or electric generating engines. However, most beverage plants do not generate a sufficient volume of gas to be economically viable, the off-gas is normally flared.
7.4 Aerobic vs Anaerobic Wastewater Treatment
It will always come up – What are the advantages and disadvantages of the two basic processes?
The advantages of aerobic treatment processes are:
a. Quickstart-up;
b. Simpletooperate;
c. Respond quickly to toxic shocks (e.g. dumps of chlorine);
Disadvantages as compared to anaerobic process are:
a. Generates more sludge;
b. Requires more chemicals for nutrients and to adjust pH;
c. More electrical power;
d. Higher operating costs;and
e. May not be suitable for especially cold climates.
The advantages of anaerobic processes are:
a. More compact footprint due to high loading–6KgBOD/m3-day;
b. Requires the addition of less chemicals;
c. Generates much less sludge;
d. Lower operating cost;
Disadvantages are:
a. Must be operated at temperatures >25o C,optimum is 35oC. Additional heat and insulation is required in a cold climate;
b. Start-up is slow,sometimes requiring up to 6 months;
c. Response to toxic shock is slow;
d. Generates a flammable gas that must be flared.
7.5 Membrane Biological Reactors
(MBR)
MBRs are a recent development in the field of wastewater treatment, and basically consist of an activated sludge process that utilizes and Ultra Filtration (UF) membrane for solids separation instead of a clarifier.
The advantage of a MBR is that the activated sludge process can be operated at a much higher F/M ratio since solids-liquid separation is not an issue. Higher levels of MLVSS (biosludge) and temperature, which increases reaction kinetics, can be maintained because solids – liquid separation is not a problem.
The true advantages of the MBR are the quality and clarity of the effluent. Effluent BOD5 and TSS levels are generally less
than 10 mg/L and the effluent can be recycled for a number of non-potable purposes.
The disadvantage of the MBR is the membrane, which is susceptible to blinding and fouling. Since no MBR has been in operation for any sustained period of time, the actual life of the UF membrane is unknown. However, some vendors are offering 5 year Guarantees on the membrane. To prevent fouling, the membranes go through periodic CIP cycles.

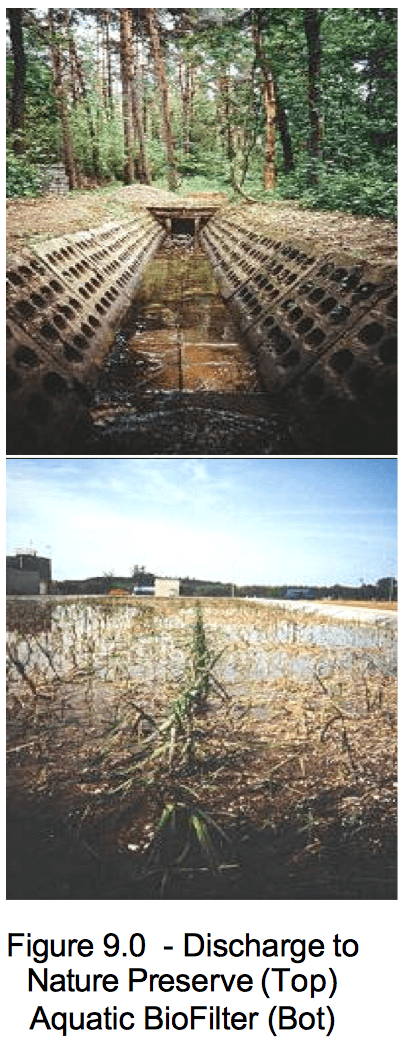
7.6 Natural BioFilters
In some cases, when a very clear and high quality effluent is required, and sufficient space is available, an aquatic biofilter is very useful. An aquatic biofilter, sometimes known as a reed pond, consists of a pond approximately one yard deep by 50 yards wide and up to 100 yards long. The pond is filled with 2 -- 4 inch rocks or stones with a 6-inch layer of 1⁄4 inch gravel. Aquatic plants, reeds, grasses, etc. are planted in the gravel. The aquatic biofilter is flooded as the wastewater flows through the pond. Bacteria attached to the roots remove nitrogen, phosphorus and organic compounds (BOD). Suspended solids are filtered or settle in the pond.
Aquatic biofilters are used as tertiary treatment systems and design to polish the effluent from a wastewater treatment plant. The photos at the right show an Aquatic BioFilter that discharges to a federal nature preserve.
8.0 WASTEWATER TREATMENT OPTIONS
8.1 Data Trending
It is always useful to review data when making an important economic decision, especially regarding a wastewater treatment plant. Two concepts are especially important -- SPC (statistical process control) and incremental change, both of which are integral to ISO standards. SPC programs are adopted to spot trends in quality, production, line efficiencies and in this case to monitor wastewater discharges. Incremental changes are implemented when SPC programs identify problem areas.
Before considering a wastewater treatment plant, the following data should be a vailable:
• Hydraulic Flow – daily mean and standard deviation;
• BOD5 Concentrations and lbs/day – daily mean and standard deviation;
• Hydraulic Flow – gallons per m3 product or 8-oz case; and
• BOD5 – percent loss.
8.2 Wastewater Treatment Processes
With all the sales persons knocking on the door touting one process over another, how does one make a decision? The criteria for deciding on a wastewater treatment process starts with considering the following:
• Desired effluent BOD 5 concentration;
• Space available – vertical and horizontal;
• Utilities available and cost of utilities;
• Operator manpower availability;
• Degree of automation desired; and
• Regulatory issues.
8.2.1 Desired Effluent Concentration
The desired or required effluent BOD5 and TSS concentrations depend on the terms of the NPDES or municipal permit. For an NPDES permit, which regulates discharge to a river or stream, the effluent BOD5 and TSS would be in the range of 10 mg/L to 30 mg/L. For a municipal permit, the range may be as low as 250 mg/L to as high as 1,500 mg/L Obviously, the lower the permit concentrations, the more money required to construct a wastewater treatment plan.
To comply with a NPDES permit, it will be necessary to construct a full-scale wastewater treatment plant.
The options are:
• BioFilter followed by Activated Sludge;
• Anaerobic USAB followed by Activated Sludge; or
• Membrane Biological Reactor.
For these options, a range of budget costs would be $2,000,000 - $2,500,000
To comply with a municipal sewer permit, it would be necessary to construct a pre- treatment plant. The options are:
• BioFilter for a range of 500 to 1,500 mg/L BOD;
• Anaerobic UASB for a range of 300 to 600 mg/L BOD; and
• 2-Stage Process consisting of BioFilter or Anaerobic followed by Activated Sludge
for < 300 mg/L BOD
For these options, a range of budget costs would be $800,000 to $2,500,000
8.2.2 Space Available – Vertical and Horizontal
The treatment process depends on the amount of space available. For example, if you have a wide open space it makes no difference as to the physical dimension of the wastewater treatment plant.
However, with limited space the following must be considered:
• With limited horizontal space, the treatment plant must be designed in a vertical fashion;
• If the treatment plant is to be constructed adjacent to the beverage plant, underground concrete tanks would not be suitable because of a deep excavation adjacent to building footers would cause potential structural problems;
• The decision to construct underground concrete or above ground steel tanks would depend on the site;
• The amount of the treatment plant above ground may impact site esthetics;
• For an anaerobic treatment plant, you would not want to locate a flare adjacent to
the beverage plant; and
• The air intakes to the beverage plant should be significant distance from the
wastewater treatment plant.
8.2.3 Availability and Cost of Utilities
Cost and availability of utilities, especially electricity, will impact on the decision of whether to construct an aerobic or anaerobic treatment plant;
8.2.5 Regulatory issues
There are a number of regulator issues that will impact on the construction of a wastewater treatment plant.
• Required effluent samplings and flow monitoring;
• Collection of surges or dumps;
• Standby power;
• Average daily and maximum limits; and
• Plant upsets and notifications.
9.0 AUTOMATION – CONTROLS
In this “lean and mean” plant environment with strained resources, it is cost-effective to wire up the entire production process. Starting with the water and wastewater systems are obvious first steps because these processes generally receive the least amount of management attention and are the easiest to wire up.
Automation and control technology today is so powerful and cheap, each plant should be initiating programs to wire up the entire production process. Computers, data acquisition systems, data highways and digital instrumentation are generally available off-the-shelf. In addition all young workers entering the workplace have grown up on the Internet and computer games. This is how they will learn and operate in the future. Companies must take this into consideration as we proceed through the 21st century.
Management of the production process and facilities must be institutionalized and programmed, because as the “Graybeards” walk out the door, institutional memory walks out with them..
There are powerful HMI (human machine interface) programs available that will perform simple tasks such as operating a water treatment plant to running the entire facility. Wonderware (www.wonderware.com) and Intellution (www.gefanucautomation.com) are two such HMI programs, and there are many computer engineers and programmers that can operate in this environment. It is also important to note that adopting either of these programs means that as technology evolves, this software will evolve at the same rate.
There are two important factors to consider when selecting computer software:
• Do not select proprietary software that is tied up in one company. The plant will pay for this decision dearly in the future. Open architecture systems are so powerful today, you do not need special systems to run your plant.
• The Company should establish software standards for the entire company. Although the IT department has established strict PC software protocols, such as what programs can run on company computers (Microsoft), few companies have established HMI or PLC standards. There have been many companies that have ripped our very expensive software systems because there were more powerful software programs on the open market and support got too expensive. Settle with
Allen-Bradley and/or Siemens PLC software and either Wonderware or Intellution HMI software.
Attachment 1.0 – Lime Softening, Sludge Generation
Attachment 2.0 – Case Histories
Beverage Plant A expanded bottled water production, which necessitated expansion of the water treatment plant and installation of a new reverse osmosis membrane. Because of increased production during the summer plus the reject water from the membrane, the wastewater flow almost doubled. To handle the increased sewer flow, part of the wastewater was pumped around the treatment system that included a mass flowmeter. The flows recorded by this flowmeter were reported to the local municipality, which used the data to calculate sewer charges for the flow and BOD. This bypass had been in operation for three years. Because of the under reporting of the flow and BOD, a potential liability of almost $1,000,000 was incurred in addition to potential fines and penalties.
These potential liabilities were caused by a lack of planning during the expansion and an unawareness of the potential liabilities involved in reported false data to a regulatory agency.
Beverage Plant B
discharged wastewater to a municipal sewer with the sewer flow determined by deducting metered water flow to the bottling lines from the main water meter. The wastewater was sampled on a time basis by a local laboratory for regulatory purposes and to establish monthly sewer bills.
A new municipal sewer district was formed and the sewer flow from Plant B was diverted to a new wastewater treatment plant (WWTP). During the planning for the new WWTP, neither the design engineers nor a representative from the sewer district approached Plant B to verify the sewer flows and BOD concentrations. A problem developed after the new WWTP came on line because of high BOD concentrations, which the sewer district traced back to Plant B. The problem was that the new WWTP was at design capacity and the State EPA would not allow any new sewer connections. No new sewer connections meant no economic expansion for this area, which disturbed the local politicians. Plant B was under pressure to reduce flow and BOD.
These problems developed because of two problems. The plant did not know the actual sewer flow and BOD, and did not follow the development of this new WWTP. As a result, the WWTP was constructed without input from the plant. The plant is planning to wire up the water system to identify potential savings and is installing a collection system for BIB and 5-gal lines. They are investigating potential waste haulers.
Beverage Plant C
discharges to a municipal WWTP with BOD5 concentrations in the range of 3,000 mg/L. Although the city is in compliance with their NPDES permit and loadings are less than the design capacity, the State EPA is forcing the City to reduce all industrial contributions to the sewer system. As a result, the plant is evaluating options for reducing BOD5 concentrations to less than 1,500 mg/L, which is the value that the City is requesting.
However the first priority is to accurately measure the sewer flow and BOD. The existing sampling and monitoring manhole is too small and when the filters are backwashed, the manhole is flooded thereby producing inaccurate data. The sampler is programmed on a time basis and thus collects inaccurate samples, as evidenced by the fact that the same number of samples are collected at low flow when pure syrup is flowing down the sewer as when the filters are backwashed and clean water is flowing down the sewer.
Beverage Plant D
discharges to a municipal WWTP, which discharges to the ocean. The plant discharges approximately 150,000 gpd, 2,000 mg/L BOD5 and 2,000 mg/L
TSS. The plant is currently paying almost $225,000 per year in sewer charges. The IWD was contacted and it was determined that the sewer charges were dependent only on flow and TSS. There were no charges for BOD. As a result, the installation of a lime softening sludge filter would have a payback of less than 12 months and would save the plant almost $100,000 per year. The problem was that the plant was not aware of the details of their permit.
Attachment 3.0 – Author’s Background
Phillip L. Hayden, Ph.D., P.E., Htec Systems, Inc., is the author of this white paper on wastewater treatment. He is an environmental process engineer who has a M.S. degree from the University of Cincinnati (1967) and a Ph.D. degree from The Ohio State University (1971). He is a registered professional engineer in the States of Ohio, New York and Florida. He is certified by the American Board of Industrial Hygiene as a Certified Industrial Hygienist and a Diplomat of the American Academy of Environmental Engineers. He served on the FAA Regulatory Advisory Committee, the State of Ohio Emergency Response Commission and served on Dayton, Ohio Regional HAZMAT Board.
Dr. Hayden has been a wastewater consultant to the beverage industry 30 years, having prepared engineering designs of wastewater treatment plants, shipped equipment, served as construction manager, commissioned start-ups and trained operators of over 30 projects all over the world.
He has conducted numerous plant water system audits to evaluate regulato ry compliance, water treatment systems, water conservation and waste minimization programs and wastewater treatment plants.
He has a broad background in environmental, health & safety including water and wastewater issues, hazardous materials, air pollution control and environmental auditing. He has considerable experience in indoor air quality issues, noise, occupational exposure to chemicals, heat stress, OSHA compliance and HS audits.
Htec Systems, Inc.
561 Congress Park Drive
Dayton, OH 45459
937 438-3010 tel
phayden@htecsystems.com
www.htecsystems.com